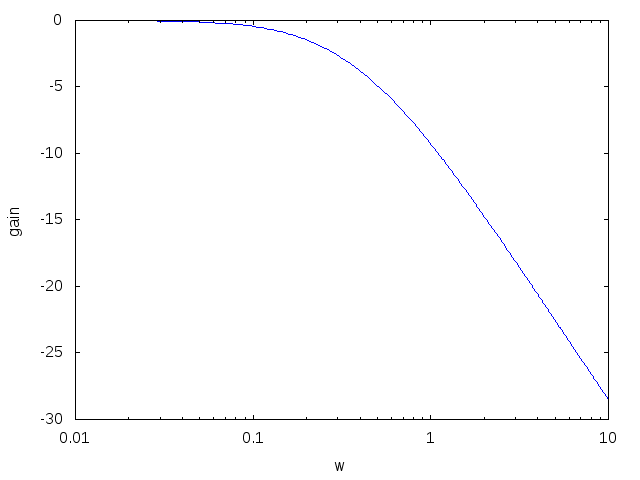
g(s):=(1+3*s)/((1+4*s)*(1+2*s));
define(gain(w), 20*log(ratsimp(abs(g(%i*w))))/log(10));
plot2d(gain, [w,0.01,10],[gnuplot_preamble, "set log x; set grid"]);
g(s):=(1+3*s)/((1+4*s)*(1+2*s)); define(gain(w), 20*log(ratsimp(abs(g(%i*w))))/log(10)); plot2d(gain, [w,0.01,10],[gnuplot_preamble, "set log x; set grid"]);